Grafana is a leading open-source platform for observability, allowing users to query, visualize, alert on, and understand metrics, logs, and traces across multiple data sources. Originally developed for time-series analytics, Grafana has evolved into a complete observability stack used by developers, DevOps teams, IT engineers, and SREs worldwide. The platform enables organizations to monitor infrastructure, applications, and cloud services through customizable dashboards and data panels, making data analysis and visualization seamless and efficient.
Features
Grafana offers a comprehensive set of features designed for monitoring and observability:
Custom Dashboards: Build interactive and customizable dashboards with real-time visualizations.
Data Source Integration: Connect with over 100 data sources, including Prometheus, Graphite, Loki, Elasticsearch, InfluxDB, MySQL, PostgreSQL, and AWS CloudWatch.
Alerting System: Create and manage alerts across different data sources with multi-channel notifications (Slack, email, PagerDuty, etc.).
Time-Series Visualization: Analyze data trends over time with graphs, gauges, tables, and heatmaps.
Unified Observability: Correlate metrics, logs, and traces using Grafana’s observability stack (Grafana, Loki, Tempo, and Mimir).
User Access Control: Implement team-based access control, roles, and permissions.
Templating and Variables: Use dynamic variables in dashboards for flexible, reusable panels.
Plugins Ecosystem: Extend functionality with community-developed and enterprise plugins.
Grafana supports a modular architecture that gives users flexibility in how they build and scale their monitoring solutions.
How It Works
Grafana acts as a visualization layer on top of your existing data sources. After installation (via Docker, Linux packages, or cloud), users configure connections to one or more data sources. Dashboards are then created using a web-based UI that supports drag-and-drop components and powerful query editors. Grafana retrieves data in real-time from the connected sources and renders it in visual panels. Users can set thresholds, generate alerts, and drill down into logs or traces to understand the root cause of system behavior. Grafana’s alert manager sends notifications via popular tools, helping teams respond to anomalies quickly.
Use Cases
Grafana supports various real-world observability and business intelligence use cases:
Infrastructure Monitoring: Visualize CPU usage, memory, network latency, and disk I/O for servers and containers.
Application Performance Monitoring (APM): Monitor application behavior and correlate performance with system metrics.
Cloud Service Monitoring: Integrate with AWS, GCP, Azure, and Kubernetes for cloud-native observability.
Business Dashboards: Track KPIs, website metrics, user activity, and transaction flows.
DevOps and SRE Operations: Investigate outages by correlating logs, metrics, and traces in one place.
IoT Monitoring: Display sensor data, machine telemetry, or industrial system performance over time.
Grafana’s flexibility makes it applicable across sectors—from tech startups to large enterprises and government institutions.
Pricing
Grafana offers both open-source and commercial pricing options:
Grafana OSS (Open Source): Free, self-hosted version with core dashboard and visualization features.
Grafana Cloud: A fully managed SaaS offering with multiple plans:
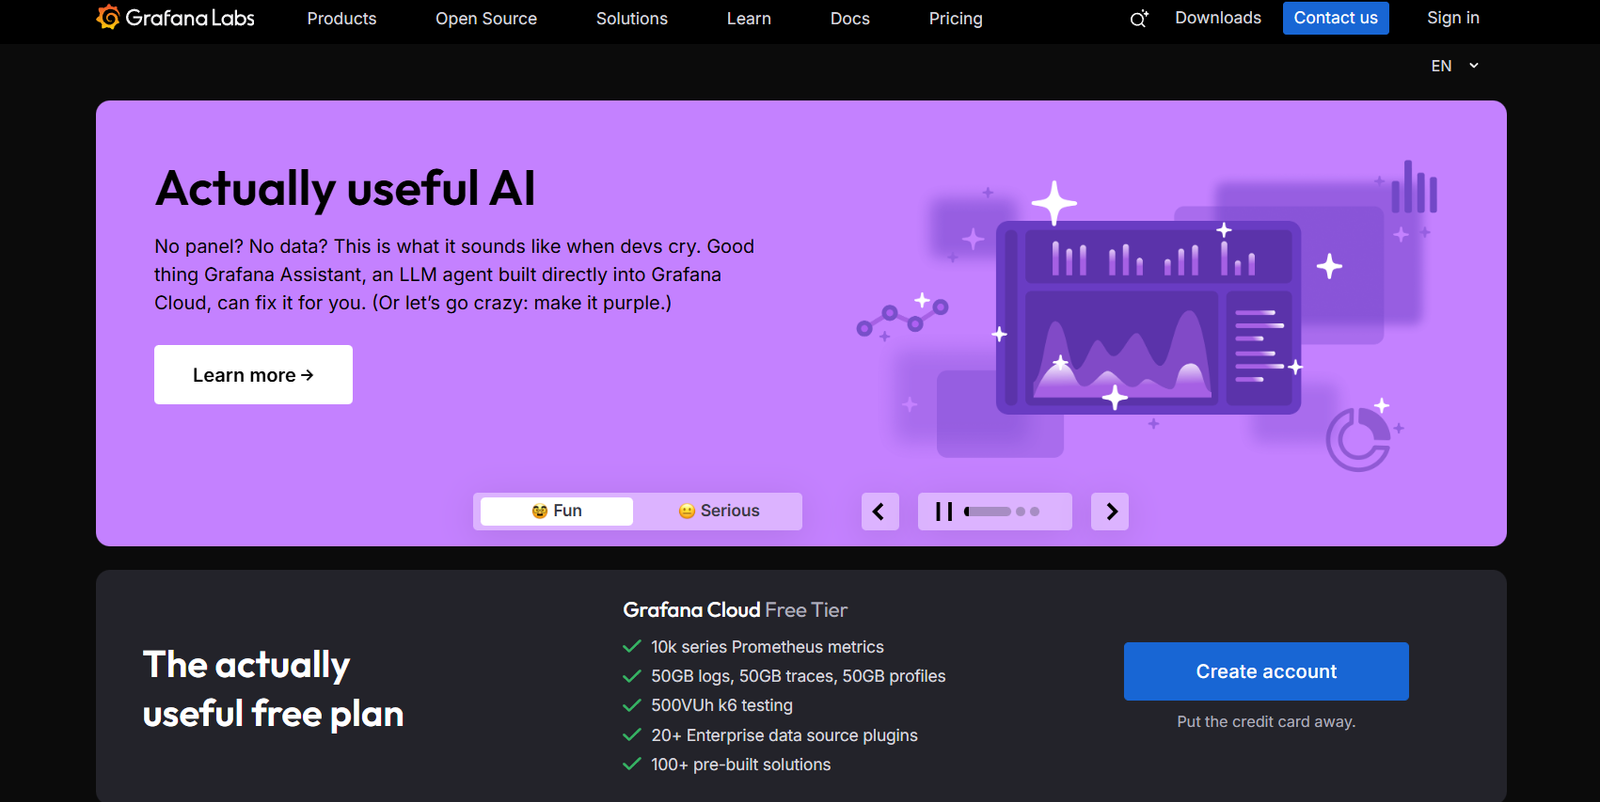
Free Tier: Up to 10,000 series for metrics, 50GB logs/month, 50GB traces/month, and 3 users.
Pro Plan: Starts at $29/month with more series, storage, and enterprise-grade features.
Advanced Plan: Custom pricing for organizations needing high scale, SSO, compliance, and dedicated support.
Grafana Enterprise: Self-hosted with enterprise plugins, reporting, and support, priced per user and usage.
Visit grafana.com/pricing for the most up-to-date pricing details.
Strengths
Grafana’s strengths include its open-source foundation, extensive plugin ecosystem, and broad integration support. It allows teams to bring together diverse observability data sources under one interface, reducing complexity and improving visibility. Its real-time dashboards are highly customizable and support collaborative operations across teams. Grafana’s scalability—from individual developers to enterprise deployments—makes it a versatile solution for both startups and large organizations. The Grafana Cloud offering also simplifies deployment for teams without infrastructure management resources.
Drawbacks
Despite its strengths, Grafana has a few limitations. Initial setup and configuration can be complex for users unfamiliar with monitoring systems or query languages. While powerful, Grafana’s UI can have a learning curve, especially for advanced templating and alert rules. The open-source version does not include features like reporting, fine-grained access control, or enterprise plugins—available only in the commercial tiers. Organizations requiring native support for certain data sources or automated anomaly detection may need third-party integrations.
Comparison with Other Tools
Grafana is often compared with platforms like Kibana, Datadog, and New Relic:
Kibana is tightly integrated with Elasticsearch but lacks multi-source support.
Datadog offers all-in-one observability but is entirely SaaS and more expensive at scale.
New Relic is a full-stack APM solution with analytics and visualization, but it requires vendor lock-in.
Grafana stands out for its open architecture, extensibility, and cost-efficiency—especially in hybrid and self-managed environments. It is ideal for teams that value flexibility, control, and community-driven innovation.
Customer Reviews and Testimonials
Grafana is widely praised by engineers, DevOps teams, and IT professionals for its performance, customization, and community support. Users highlight how the platform helps reduce troubleshooting time, improve incident response, and centralize monitoring. Testimonials also note Grafana’s powerful integration with Prometheus and Loki for complete observability. Enterprises commend its enterprise plugin ecosystem and robust dashboarding features, while small teams appreciate the free tier and self-hosted options.
Conclusion
Grafana is a trusted, open-source platform that powers modern observability across industries. With its ability to visualize metrics, logs, and traces from virtually any data source, it empowers teams to monitor systems effectively and respond to issues proactively. Whether self-hosted or in the cloud, Grafana offers a scalable, customizable, and cost-effective solution for organizations seeking unified, actionable insights. For engineering teams aiming to improve visibility, performance, and reliability, Grafana remains a top choice in the observability landscape.
