
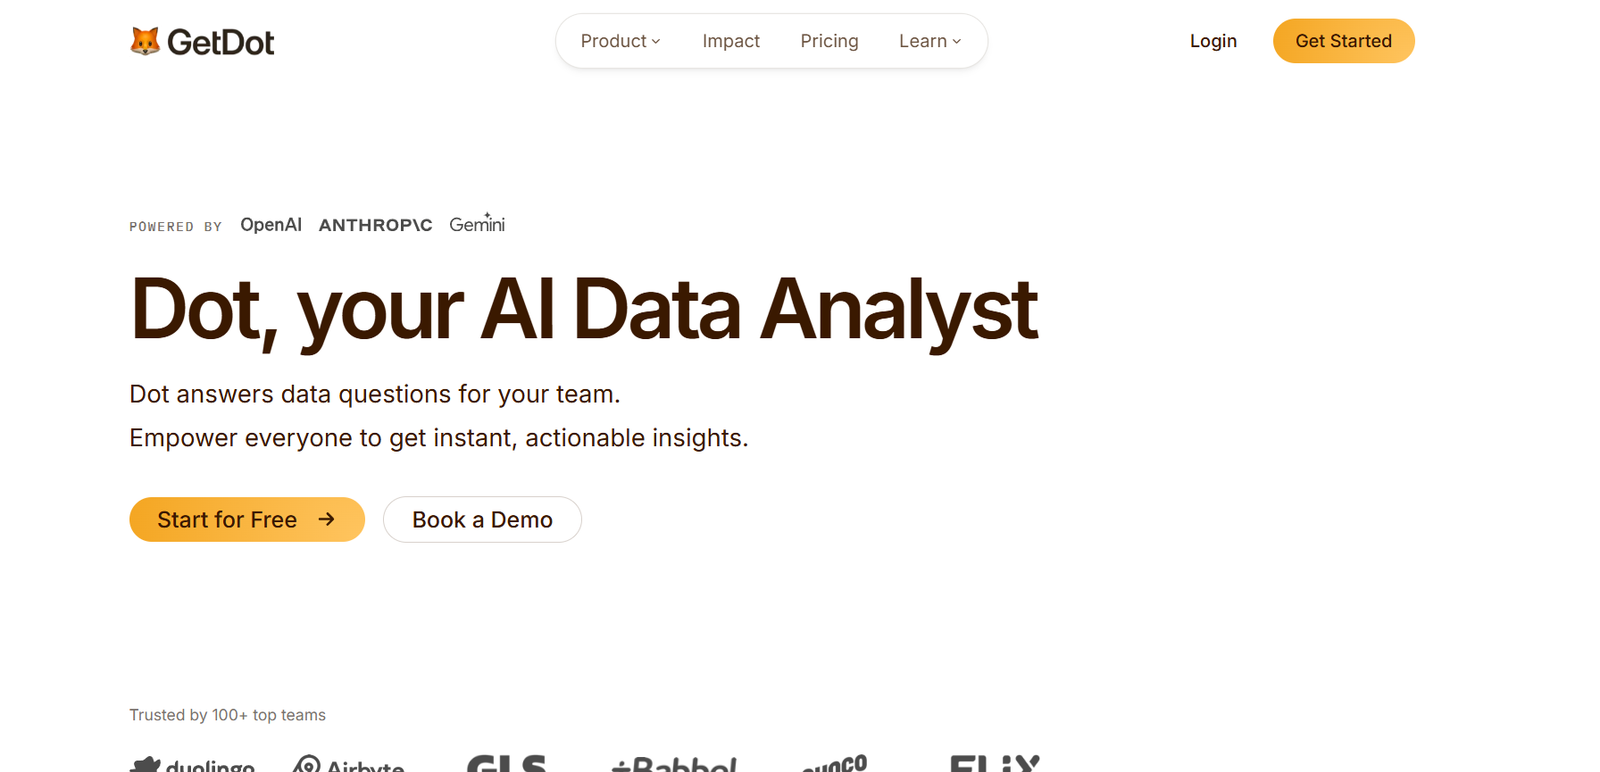
Dot is an AI-powered data analyst designed to help teams get answers from business data without relying on traditional dashboards or writing SQL queries manually. Users can ask questions in plain English, and Dot identifies relevant data, generates the required SQL, performs the analysis and presents the results with explanations and visualizations.
The platform is particularly useful for organizations that have large amounts of data but limited analyst capacity. Instead of sending every business question to a data team, employees can ask Dot directly and receive data-based answers within their normal workflow.
Dot can connect with databases, data warehouses, semantic layers and business intelligence platforms. It supports systems such as Snowflake, BigQuery, Redshift, Databricks, PostgreSQL, Looker, Power BI, Tableau, dbt and many others.
Teams can interact with Dot through its own interface or through communication tools such as Slack and Microsoft Teams. It can also deliver scheduled insights and reports through email.
Features
Natural Language Data Analysis
Users can ask business questions using normal conversational language. Dot determines which data is relevant, generates SQL and returns an understandable answer.
This makes business data more accessible to employees who do not have SQL or advanced analytics skills.
AI Data Chat
Dot provides a conversational interface for exploring organizational data. Users can ask questions about revenue, customers, sales pipelines, conversions, churn, marketing performance and other business metrics.
Follow-up questions can be used to explore the data further without creating a new dashboard for every query.
Automatic SQL Generation
When a user asks a question, Dot can identify appropriate tables and generate the SQL required to retrieve and analyze the information.
The underlying SQL remains available for auditing, which allows data teams to examine how an answer was generated.
Deep Analysis
Dot supports more complex analytical investigations in addition to simple data questions. It can perform multidimensional analysis, investigate business performance and produce detailed reports with methodology.
This makes the platform useful for analytical tasks that require more than a single database query.
Charts and Visualizations
Dot can automatically create charts and visualizations based on the analysis it performs.
This helps users understand trends and comparisons without manually creating charts in a separate business intelligence application.
Automated Reports
Organizations can schedule recurring analytical reports using live business data.
Dot can create presentation-ready reports and deliver them automatically, reducing repetitive reporting work for data teams.
Context Agent
The Context Agent helps Dot understand how an organization defines its business metrics and data.
Teams can provide instructions, examples, terminology and business rules. Dot can also work with information from data models and existing analytics systems to improve consistency across answers.
Business Logic and Organizational Knowledge
Organizations can add notes, definitions and business rules that explain how their data should be interpreted.
This is useful when terms such as revenue, active customer or conversion have specific meanings within the company.
Slack Integration
Employees can ask Dot data questions directly inside Slack.
This allows teams to access analytics within their existing communication environment instead of repeatedly switching between dashboards and analytics tools.
Microsoft Teams Integration
Dot also integrates with Microsoft Teams, enabling employees to request business insights through familiar workplace conversations.
Email Reports
Reports and insights can be delivered through email, making Dot useful for recurring management reporting and executive updates.
Data Integrations
Dot supports more than 30 data and analytics integrations.
Supported systems include Snowflake, BigQuery, Amazon Redshift, PostgreSQL, Databricks SQL, Microsoft SQL, MySQL, ClickHouse, Oracle Database, SAP HANA, Looker, Power BI, dbt, Tableau, Metabase and Sigma.
CSV and Excel files can also be uploaded for analysis.
Data Governance
Higher-level plans provide governance capabilities such as workspaces, single sign-on, row-level security and access controls.
These features help larger organizations control which employees can access particular information.
Embedded Analytics
Organizations can embed Dot within their own applications, allowing customers or internal users to interact with AI-powered analytics without leaving the application.
Security and Privacy
Dot states that it uses zero data retention policies with its LLM providers. Prompts are not used by those providers for training.
The platform queries information within the connected warehouse and returns requested results rather than copying the organization’s entire dataset.
Dot also states that it is SOC 2 Type II audited and GDPR compliant.
How It Works
Step 1: Create a Dot Account
Users can begin with the free version or select an appropriate paid plan.
Step 2: Connect Your Data
Connect a data warehouse, database, semantic layer or business intelligence system.
Connections can include platforms such as Snowflake, BigQuery, PostgreSQL, dbt, Looker and Power BI.
Step 3: Provide Business Context
Use the Context Agent to explain what the organization wants to analyze.
Dot can learn metric definitions, business terminology and rules that help it interpret company data correctly.
Step 4: Ask a Question
Users type a business question in plain English.
For example, they could ask about quarterly revenue, customer churn, sales performance or conversion rates.
Step 5: Dot Analyzes the Data
Dot identifies relevant tables and information, generates SQL and performs the required analysis.
Step 6: Review the Answer
The platform provides an explanation together with relevant data and visualizations.
Step 7: Ask Follow-Up Questions
Users can continue the conversation and investigate specific segments, periods or other dimensions.
Step 8: Schedule Reports
Frequently required analyses can be converted into recurring reports and delivered automatically.
Step 9: Share Across the Organization
Teams can access Dot through its web interface, Slack, Microsoft Teams and email.
Use Cases
Business Intelligence
Organizations can give employees easier access to company data without requiring them to learn complex BI software.
Executive Decision Making
Executives can ask questions about revenue, customers, growth, profitability and other business indicators and receive data-based explanations.
Sales Analytics
Sales teams can investigate pipeline performance, revenue, customer segments, conversion rates and account performance.
Marketing Analytics
Marketing teams can analyze campaign results, customer acquisition, conversion performance and other marketing metrics.
Product Analytics
Product teams can investigate user behavior, adoption patterns, engagement and product performance.
Financial Analysis
Finance teams can use Dot to investigate revenue, costs, financial performance and other company metrics.
Customer Analysis
Businesses can explore customer segments, churn, retention and other behavioral patterns.
Data Teams
Data analysts can reduce repetitive requests for simple information and spend more time working on complex analytical projects.
Management Reporting
Organizations can automate recurring business reports instead of manually rebuilding the same analysis every week or month.
Company-Wide Self-Service Analytics
Non-technical employees can ask data questions without writing SQL or navigating multiple dashboards.
Pricing
Dot uses usage-based pricing with credits rather than charging according to the number of users.
Free Plan: $0
The Free plan includes 300 one-time credits and does not require a credit card. It provides access to Pro features so organizations can test Dot with their own data.
Pro: $180 per month
The Pro plan includes 150 credits, with additional usage charged at $1.80 per credit. It supports unlimited users and includes more than 20 data connectors, email and Slack reports, organizational notes, business logic, Context Agent, charts, visualizations and priority email support.
Team: $720 per month
The Team plan includes 800 credits, with additional usage charged at $1.44 per credit. It supports unlimited users.
It includes everything in Pro plus workspaces, SSO, row-level security, brand customization, embedded Dot functionality, BI migration services and dedicated support.
Enterprise: Custom Pricing
The Enterprise plan is designed for organizations with larger or specialized requirements. Pricing is customized according to business needs and usage.
Annual billing provides a 10% saving compared with monthly billing.
Strengths
Dot makes business analytics accessible to people who do not know SQL by allowing them to ask questions in plain English.
Its integration with Slack, Microsoft Teams and email brings analytics into applications employees already use.
The Context Agent is valuable because organizations can teach Dot their specific metrics, terminology and business logic rather than relying entirely on generic AI interpretation.
Unlimited users on paid plans can be beneficial for organizations that want to provide analytics access across multiple departments without paying for every individual seat.
Dot also provides transparency by retaining the SQL and methodology behind analyses, allowing data professionals to review how results were produced.
Support for numerous databases, data warehouses, semantic layers and BI platforms makes the system compatible with many existing analytics environments.
Drawbacks
Dot requires organizations to have suitable business data available through a supported database, warehouse, BI system or uploaded file. Companies without organized data infrastructure may need additional preparation before receiving useful results.
The credit-based pricing model can make monthly costs less predictable when usage increases significantly.
Dot is not primarily designed as a conventional dashboard-building platform. Organizations that rely heavily on customized interactive dashboards may still need traditional BI software alongside it.
Although AI can significantly reduce routine analytical work, important business decisions should still involve human review of assumptions, data quality and analytical conclusions.
The platform may also be more sophisticated than necessary for individuals who only need occasional analysis of small spreadsheets.
Comparison with Other Platforms
Dot competes broadly with self-service business intelligence, conversational analytics and AI data analysis platforms.
Traditional BI platforms generally require users to navigate dashboards, filters and predefined reports. Dot takes a more conversational approach. Users ask questions and receive written explanations, data and visualizations without necessarily locating an existing dashboard.
Compared with simple text-to-SQL tools, Dot provides additional organizational context through its Context Agent. This helps the system understand metric definitions and company-specific business rules.
Dot can also complement existing BI infrastructure rather than necessarily replacing it. It connects with platforms such as Tableau, Power BI, Looker and Metabase while providing conversational access to the underlying information.
Organizations that primarily need highly customized dashboards may prefer conventional BI platforms. Teams that experience frequent ad hoc data requests and want broader self-service access may find Dot’s AI analyst approach particularly useful.
Customer Reviews and Testimonials
Dot presents several customer impact studies and testimonials on its official website.
Customers highlighted include Duolingo, Choco, Emerge and KRY. The published examples describe organizations using Dot to expand self-service access to business data, reduce time spent on analytical requests and uncover additional insights from existing information.
The company states that Dot is trusted by more than 100 teams. As with any vendor-published customer results, the outcomes presented in individual case studies should be viewed as examples rather than guaranteed results for every organization.
Conclusion
Dot is a powerful AI data analyst for organizations that want to make business intelligence accessible beyond traditional data teams.
Its biggest advantage is simplicity for the end user. Employees can ask questions in plain English while Dot handles table selection, SQL generation, analysis, visualization and explanation behind the scenes.
Features such as the Context Agent, automated reporting, deep analysis, Slack and Microsoft Teams integration, governance controls and broad data connectivity make Dot particularly suitable for growing and enterprise teams with established data infrastructure.
For companies where analysts spend significant time answering repetitive business questions, Dot can provide a practical self-service analytics layer while allowing data professionals to focus on deeper and more strategic analysis.


